
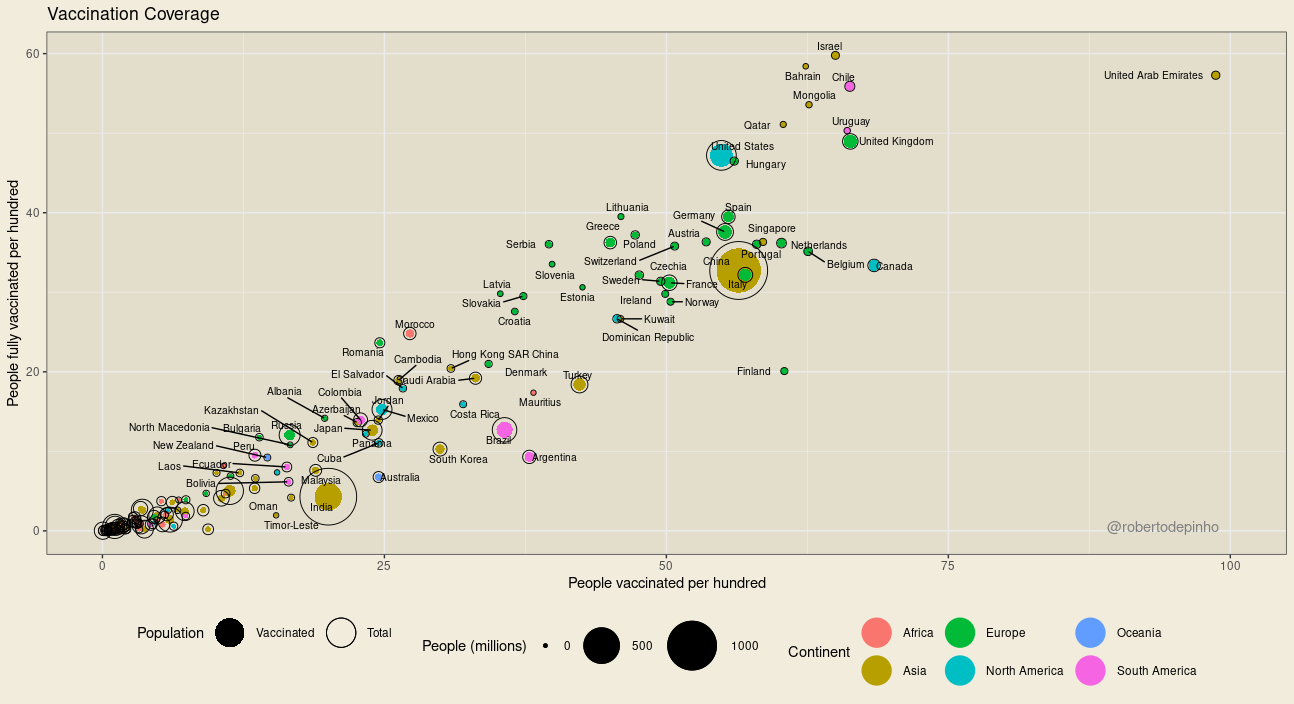
In the chart above, each dot represents a country. The size of the black outer circle represents the total population. The filled inner circle represents the population vaccinated (which received at least one dose), in absolute numbers.
The data source is Our World in Data. In this source, not all countries have data on the vaccinated population, only on the number of doses administered. In these cases, the population vaccinated with at least one dose and the population with complete vaccination are estimated using linear regression with the ratio of total vaccinations and population*. Data from the last available day for each country are used. Only countries with more than 1 million inhabitants are shown.
Charts posted daily on Twitter at @robertodepinho
Other graphics available at: Covid-19 graphics
* In earlier versions, the fully vaccinated were estimated based on the median of the ratio between applied doses and covered population observed in other countries. The vaccinated were estimated based on the assumption that it takes 2 doses to fully vaccinate a person. This second measure would thus be underestimated in those countries that use the Janssen vaccine.