
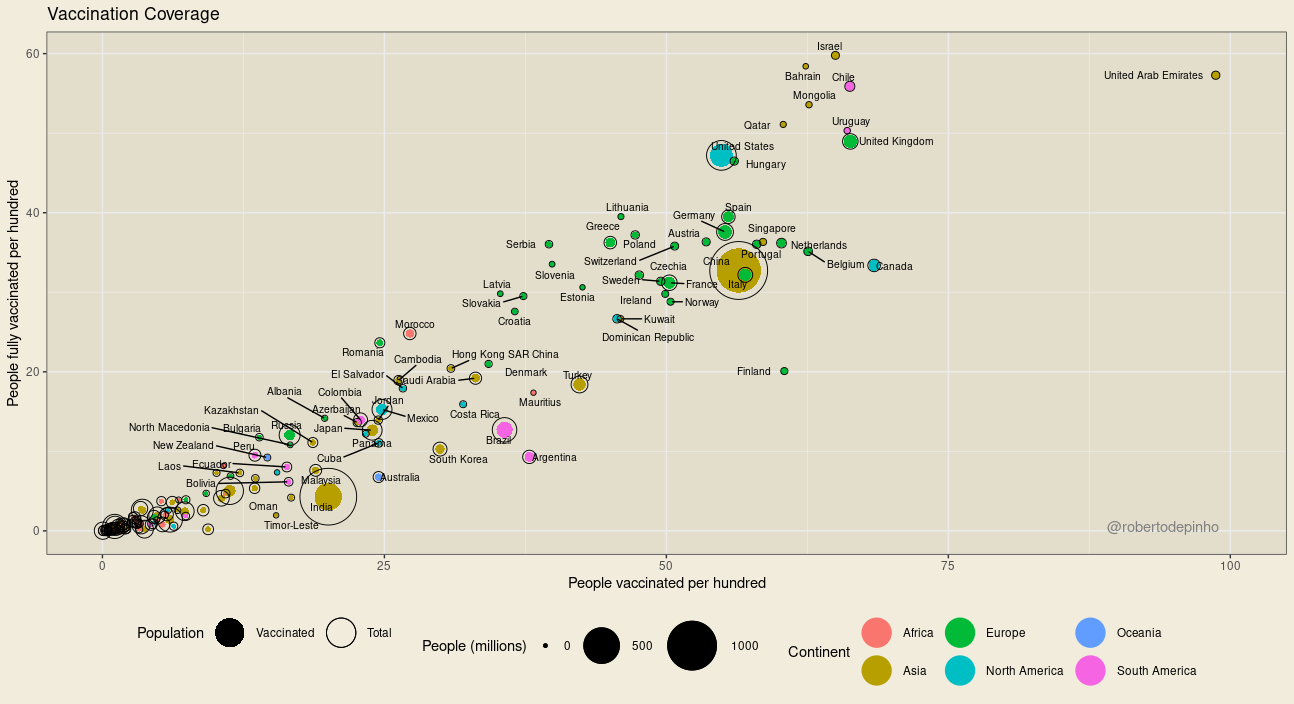
Vaccination Coverage
In the chart above, each dot represents a country. The size of the black outer circle represents the total population. The filled inner circle represents the population vaccinated (which received at least one dose), in absolute numbers.
The data source is Our World in Data. In this source,.. →

Five Indicators
During the past Brazilian presidential election campaign, a friend asked me to choose a few indicators to evaluate the next government. There is no right answer to this question and my answer reveals my personal views on the matter [of evaluating a government].
I chose five:
GINI.. →

About spoons, shovels and looms
The story plays like this: Milton Friedman is visiting some country considered to be backward, when he sees some huge construction project being built with shovels instead of tractors and other pieces of machinery. Asking why, he learns that this is to increase the number of workers needed for the.. →
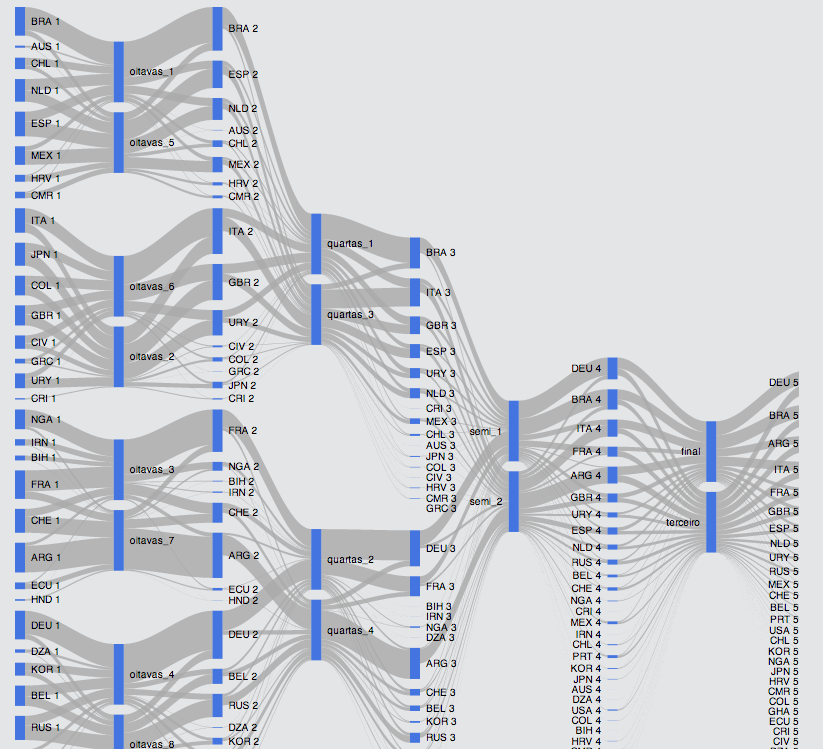
The World Cup as a flow map
A Flow Map/Sankey Diagram showing the complete results from the World Cup model:
The chart has alternating nodes (blue bars) for teams and matches. Size of flows are proportional to the chances of a country being part of a match (from country to match bar) or proportional to the chances of.. →
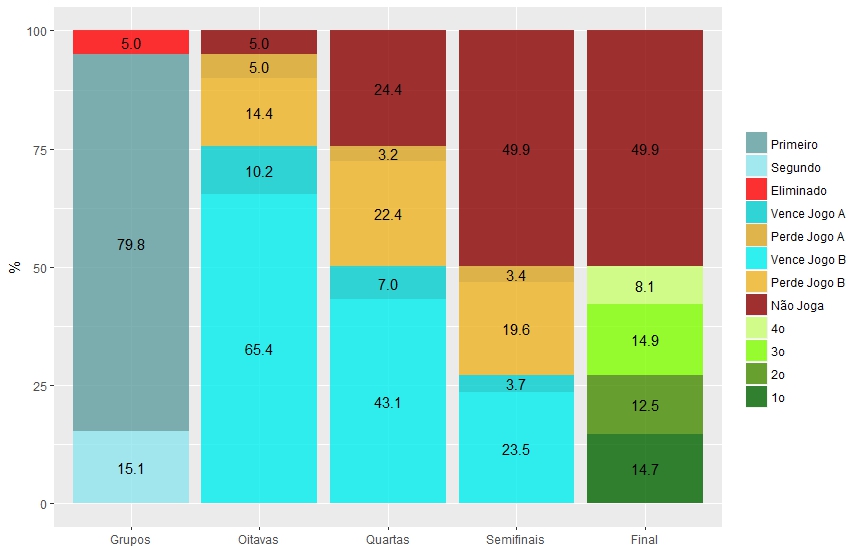
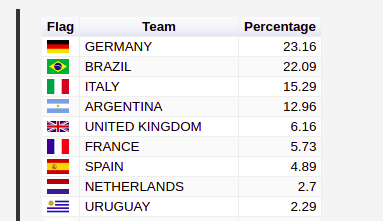
Will Germany win the world cup?
In a previous post, I showed results from a model that gives a 23 percent change of victory for Germany in this year’s World Cup. It is the highest score. So, can I jump and say that Germany will win it, or worse yet, can I bet my savings that it will do so?
Short answer is: No.
As.. →

The mean, the median and the GDP – part II
[latexpage]
A version of this post was originally published in Portuguese as a guest post at Walter Hupsel’s blog On The Rocks @ Yahoo! Brasil. This continues from The mean, the median and the GDP – part I.
Using simple arithmetic, the GINI index.. →
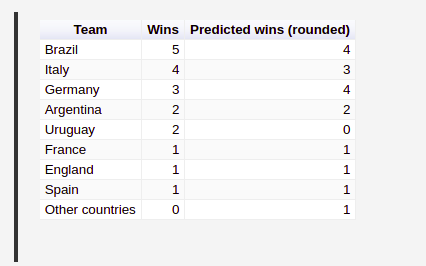
What do you tell me about the world cup?
I do not care for football (soccer). So what do you do in order not to be totally alienated from the surrounding conversations in a world cup year? More so when the cup is happening in your home country?
To me it involves running some R script to assess the chances for each team and who.. →
The mean, the median and the GDP – part I
A version of this post was originally published in Portuguese as a guest post at Walter Hupsel’s blog On The Rocks @ Yahoo! Brasil.
For over 50 years we have had Huff’s “How to Lie with Statistics” telling us that we should know better. And yet, we still rely.. →